User:Jake Mokris/Franck-Hertz: Difference between revisions
Jake Mokris (talk | contribs) No edit summary |
Jake Mokris (talk | contribs) |
(No difference)
| |
Latest revision as of 19:38, 20 February 2011

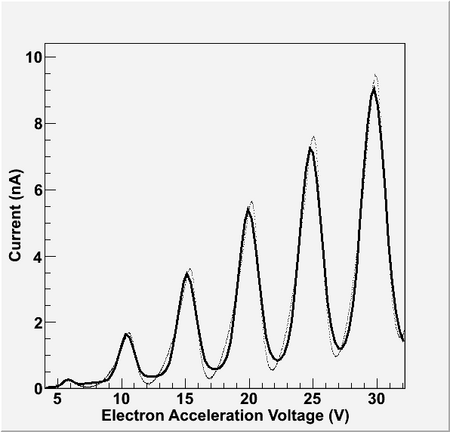
I finished writing a program to fit the Franck-Hertz data; here it is: Media: Franck_Hertz_Analysis.txt. Again, change the extension to .C before running the program. I explain how it works in the comments before the code, so here I'll say what the result was: The fit worked better than I expected; however, as the program fits the data to gaussians, the peaks are a small distance from the actual peaks in the data - which is where the energy levels are. So really, the fit is inherently flawed: it doesn't give a good value for the location of the peaks. A fit to skewed gaussians (perhaps to a lognormal distribution) would work better.
Also, since what we're after in the data is the distance between peaks - i.e., the period - taking the Fourier transform of the data might be a good idea. But I haven't worked on that yet, and I don't know much about the actual implementation of a Fourier transform on a discrete data set (though I could tell you all about Schwartz space (which has nothing to do with Spaceballs)).
Finally, here's the link to Petar's Franck-Hertz macro from 2005.
Warning!
Do NOT leave the Franck-Hertz tube temperature above 200 C for extended periods of time! See the bottom of the first page of the tube manual:
"Ensure via control of the oven temperature (i.e. the oven voltage) that the maximum temperature limit for the Franck-Hertz tube is not exceeded (permanent operation 200 C, short-term peak value 220 C)."
After reading this, Justin and I kept the tube above 200 C for no longer than about 30 minutes.